
Return Period in Years for FEMA Declared Disasters by County
This map produced by Global Data Vault, shows the average number of years between FEMA declared Disasters for each county in the United States. One can surmise that the darker density counties are at higher risk for a disastrous event that could potentially effect the continuity of your business.

We have done numerous deep dives into this data. Each section of the U. S. is impacted by different types of disaster events. Southern California suffers wildfires, the plains states have tornadoes, the gulf and Atlantic coast hurricanes, and the Midwest, the North Atlantic states and New England all endure snow and ice related events. That said, there are many seemingly random exceptions. The point is it’s best to be prepared for not only common, but also uncommon events.
More Disaster Studies Posts
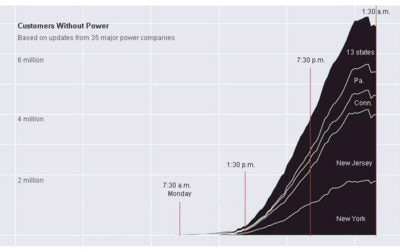
Hurricane Sandy Power Outages
From the New York Times, here is a breakdown by time and state of the more than 6 million customers affected with Hurricane Sandy power outages this morning based on information updates from 35 major power companies: For more details on the impact see the New York...
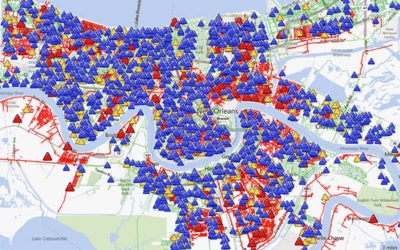
New Orleans After Isaac – Update 7
With power mostly restored now - and apologies to those still waiting, this will be our final update in our New Orleans After Isaac series. Hurricane Isaac was a Category 1 hurricane. By wind speed, it was barely even that strong, with top sustained winds of 80 mph....
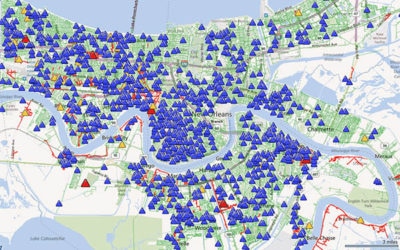
New Orleans After Isaac – Update 6
Real progress is finally visible today. While many are still without power, there is surely a light at the end of the tunnel for those homes and businesses still waiting. A new color is peaking through now on the map: green!
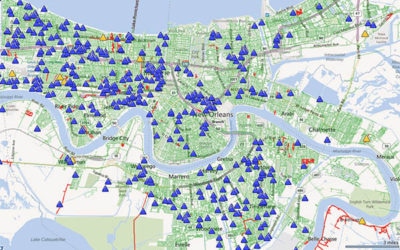
New Orleans After Isaac – Disaster Update 4
If you look carefully today, you can see some improvements since Isaac struck. The map is much more blue than red - clearly, the outages are being reduced. Entergy had said they would have power back to 90% of those "ready for power" by September 6. Hopefully this...
Why do Georgia and South Carolina have the least amount of natural disasters in their area?