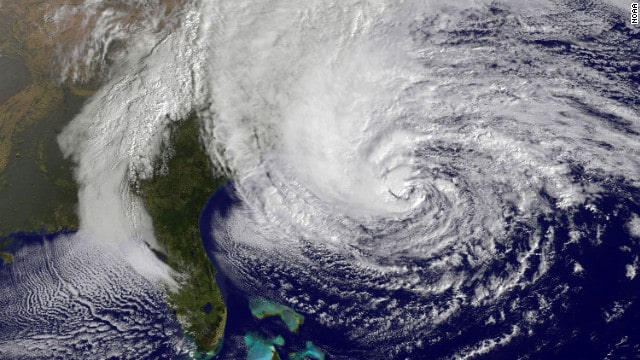
Hurricane Sandy provided a fascinating opportunity to study the both the level of disaster planning and the resilience of New York City data centers. This article will examine a) what actually happened, b) what was the risk, and c) what are the lessons learned.
What Actually Happened?
Simply put, data centers in New York were caught off guard. Consider these incidents.
Internap and Peer 1, located at 75 Broad Street, suffered basement-level flooding which knocked out diesel fuel pumps.
Datagram, located at 33 Whitehall, experienced the exact same problem – 5 feet of water in the basement. As a result several high profile blogs and numerous websites went dark.
Both of these facilities are located a Zone A flood zone. Zone A is FEMA’s second highest risk category.
Then there were fuel supply issues. Fog Creek who makes and hosts Trello, Copilot and other popular platforms is in Peer 1 had to assemble a bucket brigade to carry diesel fuel up 17 stories to refuel a generator at Peer 1. As a precaution Trello was moved to Amazon Web Services and it seems to have suffered limited downtime, but the bucket brigade was required.
Shoretel, the VoIP provider, had 3 data centers – all in lower Manhattan, including 75 Broad St which did successfully switch over to generator power but due to “city restrictions” they had shut the generators down. 700 customers went down.
Fortunately, things did not get worse for Fog Creek, but carrying 5 gallon buckets of diesel fuel up 17 stories in a building with power problems strikes us as a recipe for something truly horrible.
 Teams from Squarespace fill buckets with diesel fuel to haul them up 17 stories to the generator keeping the data center online. Staff from Peer 1, Squarespace and Fog Creek Software have formed this unusual Internet bucket brigade. (Photo via Squarespace)
A typical rack of servers requires 5 to 10 KW of power including cooling/HVAC. Typical data centers range in size from 5,000 to 40,000 square feet. A mid-sized facility at 20,000 SqFt would house about 600 racks. That equates to roughly 5 megawatts (MW) of power. A reasonably efficient diesel generator would require roughly 200 gallons of diesel per hour to push out 5 megawatts – that’s a bit over 3 gallons per minute.
Typically data centers tell us they have 1 week of diesel onsite and a resupply contract. A full week for a 20,000 SqFt data center is 34,000 gallons. We suspect that in lower Manhattan, the standard was more like 1 day. Then resupply problems hit because of the street flooding, and road and bridge closures.
What was the Risk?
The Mid-Atlantic States do not see nearly as many hurricanes as the Southeast and the Gulf Coast of the United States. The average return period for hurricanes within 50 miles of New York City is 18 to 19 years.
For the largest part of Hurricane season the Typical Hurricane Tracks, as observed by NOAA, take these storms out to see at the more northern latitudes of the NYC area.
Here are the July, August and September typical tracks:


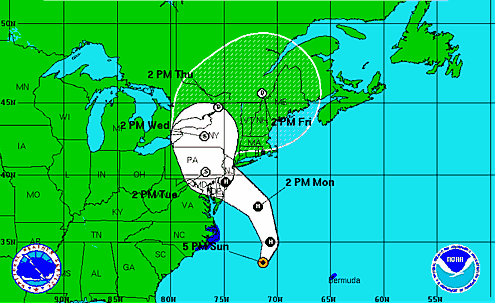
But look at how this changes in October:

And notice how closely Hurricane Sandy lined up with the typical October track.

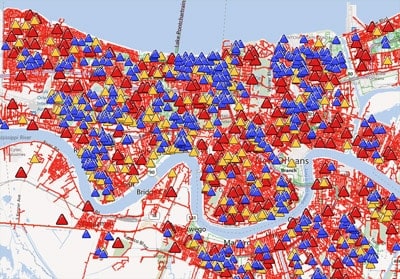
Finally, what about the frequency of storm origin in October? Compare below the frequency map for August 21 – 31 origin, which is the peak of Hurricane Season, to the October 11 – 20 origin map below:


You can see that activity is less in October, but it’s hardly dormant as it is a few weeks later:

Just as August and September are the periods of greatest risk in the Southeast and the Gulf Coast, October clearly presents the greatest risk of hurricanes in NYC.
What is the solution?
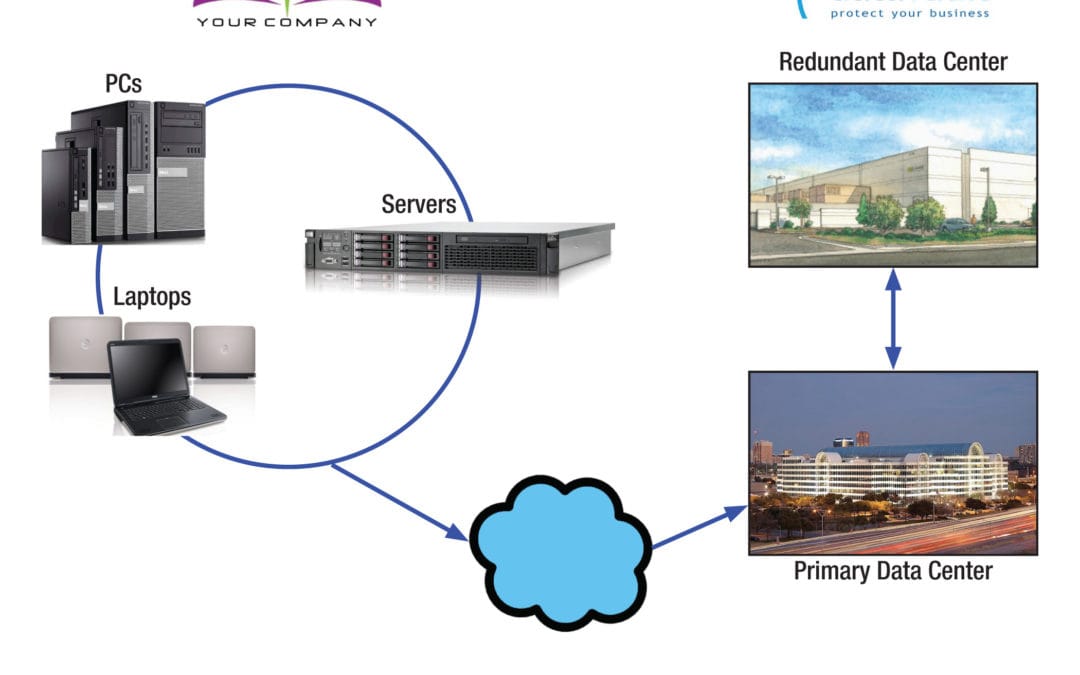
If these providers had built to the following standards, downtime would have been minimized:
- One week of fuel for standby power onsite
- Resupply plan for fuel in place – or
- A redundant or backup site more than several hundred miles away
For any disaster recovery, hosting or colocation solution, we would look to the Uptime Institute who publishes the Data Center Site Infrastructure Tier Standard for Operational Sustainability.
Based on their standard, we’d offer the following. Red indicates higher risk profile of Lower Manhattan.
| Disaster Risk Component |
Higher Risk |
Lower Risk |
| Flooding and Tsunami |
< 100 Year Flood Plain |
> 100 Year Flood Plain |
| Hurricanes and Tornadoes |
High |
Medium |
| Seismic Activity |
Zone 3 or 4 |
Zone 2A or 2B |
| Airport/Military Airfield |
< 3 miles from active runway |
> 3 miles from active runway |
| Adjacent Properties |
Chemical plant, etc. |
Office buildings, land |
| Transportation Corridors |
< 1 mile |
> 1 mile |
To review your site’s risk of various natural disasters, see our Natural Disaster Risk Maps.


 the progress was slow (as tensions built) in the beginning, but by the 5th, major headway was made and tempers were calmed. Poor Entergy though, they just couldn’t get a break. Problems with an electrical substation knocked out power to about 11,000 customers in the Central Business District, Mid-City and Uptown a few days post recovery which no doubt added fuel to the fire.
The good news – if there is good news after a hurricane — is that Officials with the National Weather Service said that their modeling of hurricanes before and after the improvements in New Orleans show no evidence that they led to increased flooding in the River Parishes. The great news is that the levees held. That’s a key accomplishment for Mayor Mitch Landrieu and a credit to his leadership over the past several years. However, we cannot forget that Isaac was only a category 1 hurricane. Katrina (2005) was a 3 hurricane when it came ashore. Here is a list of storms that reached Category 5 in the past ten years:
the progress was slow (as tensions built) in the beginning, but by the 5th, major headway was made and tempers were calmed. Poor Entergy though, they just couldn’t get a break. Problems with an electrical substation knocked out power to about 11,000 customers in the Central Business District, Mid-City and Uptown a few days post recovery which no doubt added fuel to the fire.
The good news – if there is good news after a hurricane — is that Officials with the National Weather Service said that their modeling of hurricanes before and after the improvements in New Orleans show no evidence that they led to increased flooding in the River Parishes. The great news is that the levees held. That’s a key accomplishment for Mayor Mitch Landrieu and a credit to his leadership over the past several years. However, we cannot forget that Isaac was only a category 1 hurricane. Katrina (2005) was a 3 hurricane when it came ashore. Here is a list of storms that reached Category 5 in the past ten years: